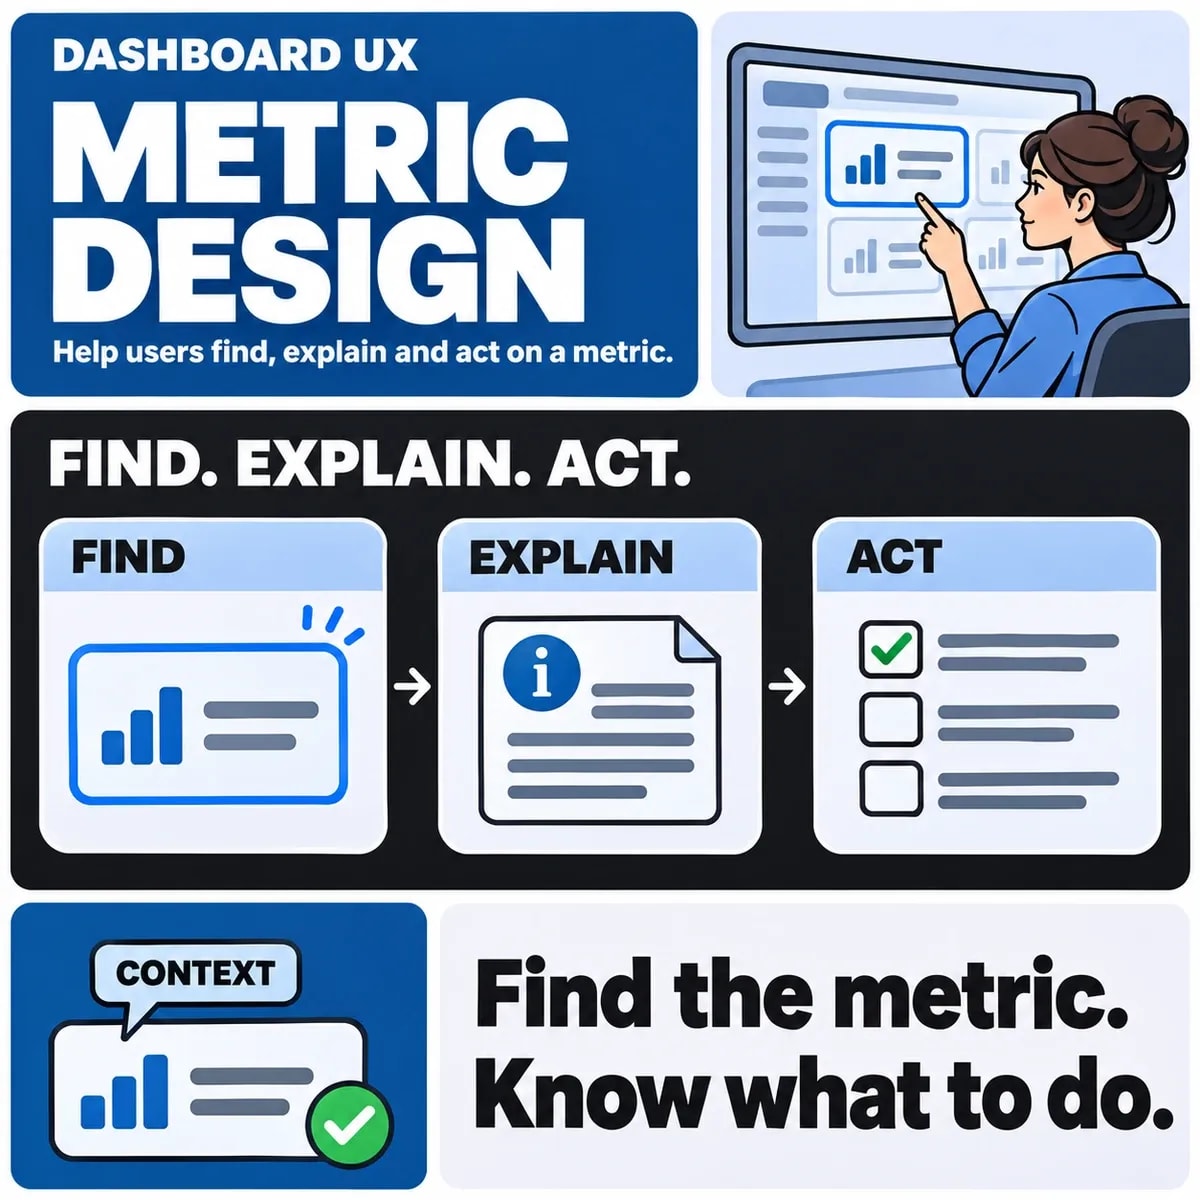

Dashboard UX design should help a person understand a situation and decide what to do next. The starting point is the user's role and recurring decision, followed by the information needed to support it. Choosing chart styles comes later.
A screen filled with accurate numbers can still be hard to use if the reporting period, freshness or next action is unclear. Treat those explanations as part of the interface, alongside navigation, filters and visual hierarchy.
Start with a decision and its owner
Identify who uses the dashboard and when. An operations manager reviewing unresolved work needs a different view from an analyst investigating a trend. Write down the question, the action it may trigger and the detail needed to justify that action.
For a fictional service team, the question might be which requests need attention today. A useful view could show work awaiting assignment, its age and a route to the permitted queue. This is an illustrative interface brief, not a record of customer performance.
Agree metric meaning before drawing the chart
Define each measure's population, calculation, period and source. Does “open request” include items awaiting the customer, and is “today” based on the viewer's time zone? The interface should expose the explanation necessary for the user's decision.
Use the existing metric dictionary guide to document definitions. Dashboard design applies those definitions to a workflow; it should not silently invent a second calculation because a different number fits the layout.
Prioritise the path from overview to detail
Give the most important task a clear entry point. A summary can lead to a filtered table, an explanation or an authorised operational action. Make the relationship between a card and its detail view explicit so a user can verify what contributed to a total.
Do not make a chart the only route to essential information. A useful table or textual summary can help people compare exact values, inspect records and use assistive technology. Choose representations from the question rather than requiring every metric to become a graph.
Design data states as carefully as the default view
| State | What the user needs to understand | Useful design response |
|---|---|---|
| Loading | The requested result is not yet available | Show progress without implying a zero value |
| No matching records | The selected scope produced no results | Explain filters and offer an appropriate reset |
| Delayed data | The displayed period or source is incomplete | Show freshness and relevant limits |
| Unavailable source | The result cannot currently be retrieved | Explain the state and a safe next step |
| Restricted access | The viewer cannot use part of the workflow | Give an appropriate access route without exposing protected data |
A failed data request should not quietly become “0”. Equally, a zero should not be hidden behind a permanent loading state. Agree these meanings with the people responsible for the data and application.
Make filters and comparisons understandable
Show the active date range, selected groups and comparison basis near the result. If one view uses a full month and another uses a partial month, explain the difference before encouraging a comparison. Define which selections persist when moving between overview and detail.
Test browser navigation and shared links where the product supports them. Users should be able to explain why a total changed after applying a filter. Preserve a clear route back to a known scope rather than forcing a full session restart.
Use colour as support for meaning
A red status or green bar needs another way to communicate the important information. Use meaningful labels, symbols or patterns as appropriate, and check the interaction with text and contrast. W3C's Use of Color guidance explains why colour alone should not carry meaning.
Also test keyboard movement, focus visibility, zoom and the reading order. A dashboard screenshot cannot demonstrate those interactions. Accessibility acceptance should cover the actual controls and information required to complete the task.
Keep permissions consistent through the journey
A summary, export and drill-down need compatible access rules. A user who can see a total should not automatically gain access to every contributing record. Ask how sensitive details, small groups and support access are handled in the actual application.
The interface should reflect enforced access, while the system must check permissions at the relevant boundary. Hiding a button is not the underlying access control. Record the user roles needed for acceptance testing.
Test whether a user can explain and act
Give representative users a business question and observe their route. Can they identify the period, understand a changed metric, find the supporting detail and choose the intended action? Record points of uncertainty instead of asking only whether the layout looks clear.
Use the business intelligence guide for the data and reporting foundations. A UI/UX design brief can then define the dashboard's roles, decisions, data states and prototype tests. Include a data owner and an application engineer so the visual design remains connected to reliable behaviour.