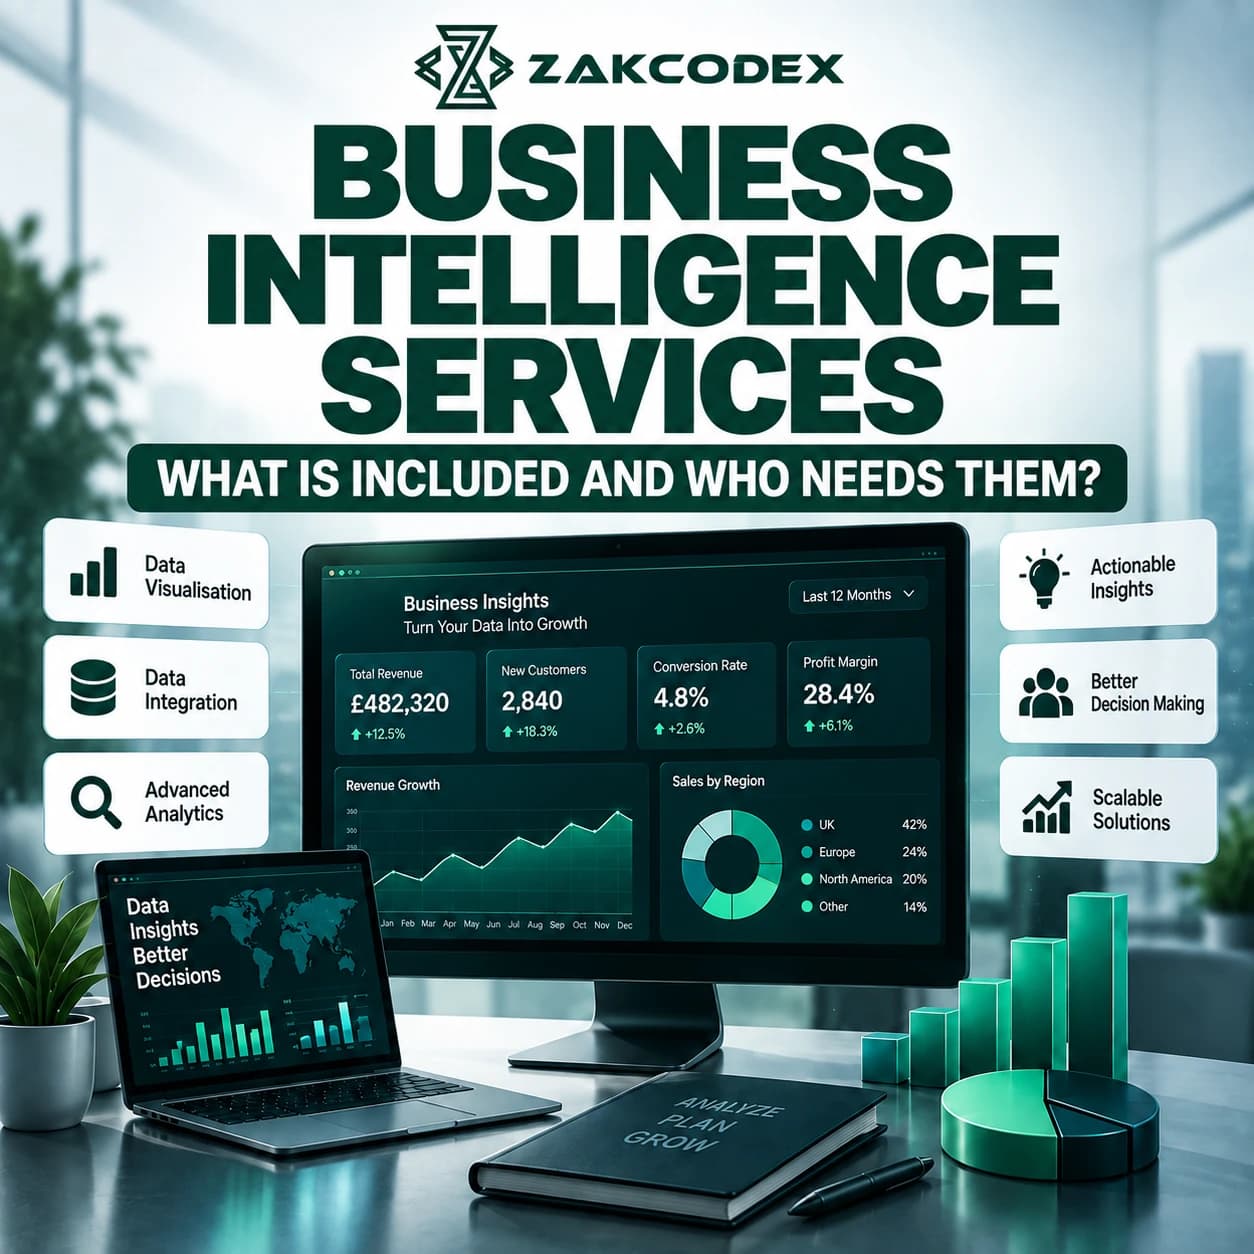
Business intelligence services typically include data integration, cleaning, modelling, dashboards, KPI definitions, automated reporting, governance and user training. They benefit small businesses struggling with spreadsheets, growing companies connecting departments, and enterprises needing consistent performance measures. Organisations evaluating business intelligence services should assess the complete journey from source data to decisions, rather than judging a solution by its charts alone.
What is business intelligence?
Business intelligence (BI) combines processes, data models and software to help people understand organisational performance. It turns operational records into information that managers can compare, investigate and act upon. IBM describes BI as collecting, managing and analysing organisational data to inform business decisions in its business intelligence overview.
A dashboard summarises selected measures visually; a report provides structured detail. A KPI is a measure tied to an objective, such as gross margin against target. Business intelligence systems connect these elements through shared definitions, so departments can discuss the same numbers.
What is included in business intelligence services?
Business intelligence consulting services can cover strategy, engineering, reporting and ongoing operation. Contracts vary: a dashboard project may exclude source-system repairs, forecasting or managed support. Request named deliverables and acceptance criteria.
| Service | What it includes |
|---|---|
| Strategy and discovery | Decision priorities, KPI definitions, source audit and delivery roadmap |
| Data integration | Connections to CRM, ERP, finance, ecommerce and marketing systems |
| Cleaning and transformation | Duplicate handling, validation and consistent dates, currencies and categories |
| Warehousing and modelling | Historical storage, relationships and reusable calculation definitions |
| Dashboards and reporting | Performance views, filters, comparisons and scheduled distribution |
| Governance and adoption | Permissions, ownership, documentation, training and support |
How are data sources connected and cleaned?
Data integration brings authorised records together through connectors, APIs, databases or controlled file imports. Cleaning then resolves inconsistencies before they distort reporting. Teams must agree which system owns each field.
For example, CRM opportunities, ERP orders and finance invoices represent different events. Matching them requires stable identifiers and rules for cancellations, refunds and late updates. API integration may also require pagination, retry handling and monitoring when source interfaces change.
ETL means extract, transform, load; ELT performs transformation after loading into the destination. AWS explains this processing distinction. Neither approach removes the need for quality checks and traceable transformations.
Why do warehouses and data models matter?
A data warehouse stores integrated information for analysis, while a data model defines relationships and calculations. Together, they support consistent historical comparisons. A small implementation may start without a separate warehouse if its reporting needs remain limited.
Define the grain: does each row represent an order, order line or monthly balance? Joining incompatible grains can inflate totals. Microsoft's star-schema guidance distinguishes fact tables containing events or observations from dimensions such as products and dates, and recommends consistent fact-table grain.
What makes dashboards and automated reporting useful?
Business intelligence dashboards should answer specific operational questions and make exceptions visible. Business intelligence reporting should provide enough detail to investigate them. Attractive data visualisation cannot compensate for an undefined metric.
Document each KPI's formula, owner, source, exclusions and refresh schedule. Show actual performance against targets, relevant comparison periods and freshness timestamps. Scheduled management reports should flag failed refreshes, rather than quietly distribute stale figures.
Are real-time analytics, self-service and forecasting included?
These are possible extensions, not automatic inclusions in every BI engagement. Specify the required freshness, user freedoms and forecasting outputs before agreeing scope.
Real-time reporting depends on the complete path from source capture to display. Microsoft's Power BI refresh documentation explains how refresh behaviour varies with connection and storage modes. Daily updates may suit management reporting; operational alerts may require shorter delays.
Self-service analytics lets authorised users explore governed data without requesting every report from IT. Predictive analytics estimates future outcomes rather than simply displaying history. Data forecasting needs suitable historical data, validation against unseen periods and explicit uncertainty; it should be scoped separately where necessary.
Who needs business intelligence solutions?
Organisations need BI when recurring decisions depend on information that is fragmented, delayed or disputed. Complexity and decision frequency matter more than employee count. Business intelligence for small business can begin with a narrow reporting problem.
| Organisation | Typical priority | Proportionate starting scope |
|---|---|---|
| Small business | Replace repeated exports | Sales and cash visibility from a few sources |
| Mid-market | Align departments | Shared customer, product and profitability models |
| Enterprise | Govern enterprise analytics | Domain ownership, access policies and scalable platforms |
Signs of outgrowing manual reporting include repeated reconciliation, conflicting revenue totals, dependence on one spreadsheet owner, and decisions made before reports arrive. If a reliable spreadsheet already answers an occasional question, a larger BI programme may be unnecessary.
Which departments use business intelligence?
Sales, marketing, finance, operations, customer service, ecommerce and leadership can all use BI. The strongest business intelligence use cases connect a measure to an action. These illustrative business intelligence examples show that relationship.
| Function | BI use case | Decision supported |
|---|---|---|
| Sales | Combine CRM and sales data; track conversion by team | Investigate stalled opportunities |
| Marketing | Compare channel spend with qualified leads and sales | Review budget allocation and attribution assumptions |
| Finance | Track revenue, margins and actuals against budget | Investigate product profitability |
| Operations | Monitor inventory trends and fulfilment delays | Adjust replenishment or capacity |
| Customer service | Compare response times, repeat contacts and retention | Investigate recurring service failures |
| Ecommerce | Analyse conversion, returns and repeat purchases | Review product and checkout problems |
| Executives | Review cross-functional KPIs with freshness indicators | Assign owners to emerging risks |
How does BI differ from analytics, reporting and spreadsheets?
BI usually emphasises repeatable performance visibility; data analytics has a broader investigative scope. Business analytics applies analytical methods to business questions, including forecasting and optimisation. These terms overlap and are not rigid product categories.
| Approach | Typical emphasis | Example |
|---|---|---|
| Business intelligence | Shared performance monitoring | Weekly margin dashboard |
| Data analytics | Exploration and explanation | Investigate retention differences between cohorts |
| Business analytics | Business outcomes and scenarios | Estimate demand under alternative assumptions |
| Traditional reporting | Predefined snapshots | Monthly departmental statement |
Data analytics services can investigate patterns surfaced by BI. Reporting and analytics work together: identifying a declining metric starts an investigation; it does not establish its cause.
| Consideration | Spreadsheets | Governed BI |
|---|---|---|
| Exploration | Flexible for individual calculations | Reusable models and shared views |
| Recurring refresh | Manual or automated, depending on setup | Managed pipelines and refresh monitoring |
| Consistency | Requires careful version and formula control | Central definitions, if maintained |
| Ownership | Can concentrate knowledge in individual files | Still requires accountable data owners |
What are the benefits and implementation challenges?
Business intelligence benefits include less repetitive preparation, consistent measures and earlier visibility of exceptions. These improvements support data-driven decision making when someone owns the resulting action. BI does not guarantee higher revenue.
| Potential benefit | Challenge to address |
|---|---|
| Faster management reporting | Broken integrations or unreliable refreshes |
| Comparable departmental KPIs | Disagreement over definitions |
| Earlier bottleneck detection | Missing or delayed source records |
| Wider analytical access | Permissions and user training |
Compare trends by product, region or customer cohort to locate risks and opportunities. Investigate seasonality, changed definitions and incomplete periods before acting. Poor data quality limits BI accuracy, regardless of the business intelligence tools selected.
How should business intelligence implementation work?
Start with a business decision, deliver a validated pilot, then expand. A business intelligence strategy should prioritise questions, owners and acceptance tests before selecting software.
- Discover: identify decisions, reporting pain and source owners.
- Audit: assess access, history, quality and integration constraints.
- Define: agree KPIs, grain, refresh targets and permissions.
- Build: implement pipelines, models and a focused dashboard.
- Validate: reconcile totals, test refunds and missing records, and check access.
- Adopt: train users and assign responsibility for exceptions.
- Operate: monitor refreshes, costs, usage and definition changes.
Acceptance should include agreed reconciliation tolerances, freshness targets and access tests.
| Practical maturity stage | Next priority |
|---|---|
| Manual reporting | Agree metrics and source ownership |
| Connected reporting | Validate pipelines and shared models |
| Governed self-service | Train users and control definitions |
| Predictive decision support | Validate forecasts and monitor outcomes |
What governance and security controls matter?
Define who may view, change and export information, and who owns its accuracy. Apply least-privilege permissions, authentication, auditability and documented retention rules throughout the architecture.
Test access using representative user accounts. Microsoft's row-level security documentation explains that Power BI row restrictions apply to workspace Viewers, whereas Admins, Members and Contributors are not restricted by those rules. Visual filters alone are not security controls.
Should businesses buy, build or customise BI?
Use established business intelligence platforms where they meet requirements; customise the parts that need distinct workflows or integrations. Business intelligence software selection should follow a representative pilot, including permissions and refresh tests.
| Approach | Best fit | Trade-off |
|---|---|---|
| Buy and configure | Standard internal dashboards | Licensing and platform constraints |
| Build internally | Established engineering capacity | Ongoing maintenance responsibility |
| Custom or hybrid | Embedded analytics or unusual integrations | Additional development and testing |
Power BI consulting should address modelling, refresh, security and adoption. Custom software development becomes relevant when analytics must sit inside a specialised application.
Cloud BI can reduce infrastructure administration; on-premise BI offers direct infrastructure control but requires internal operation. Hybrid arrangements introduce connectivity dependencies. Compare hosting, identity, data-location requirements and support responsibilities rather than assuming either option is inherently safer.
How much do BI services cost, and how should providers be compared?
Cost depends on sources, data quality, modelling, users, security and operating requirements. A limited dashboard and a governed enterprise platform are different projects; request a scoped estimate rather than an unsupported average.
Separate discovery, integration, implementation and training from recurring licences, cloud consumption and support. Managed data services should specify monitoring, incident ownership and change allowances. Analytics setup services alone may not include ongoing operation.
When comparing business intelligence consulting, data platform consulting or data analytics consulting, ask for model documentation, reconciliation evidence, handover arrangements and ownership terms. UK buyers assessing data analytics services UK providers or Power BI consultants UK teams should also clarify support hours and hosting arrangements.
Who should invest in BI services first?
Prioritise BI when recurring reporting friction obstructs important decisions and an owner can act on the results. Begin with one measurable problem, such as unreliable margin reporting, then expand once users trust the data. Effective data and analytics services connect dependable information with accountable decisions.